SINGAPORE – In its 2020-2024 Floating Production Systems Outlook Report, Energy Maritime Associates (EMA), analyzed the activity in 2019, recent industry trends and conducted a sentiment survey to develop a forecast for all types of Floating Production Systems including FPSO, FLNG, FSRU, TLP, Spar, Semi, and FSO.
Highlights:
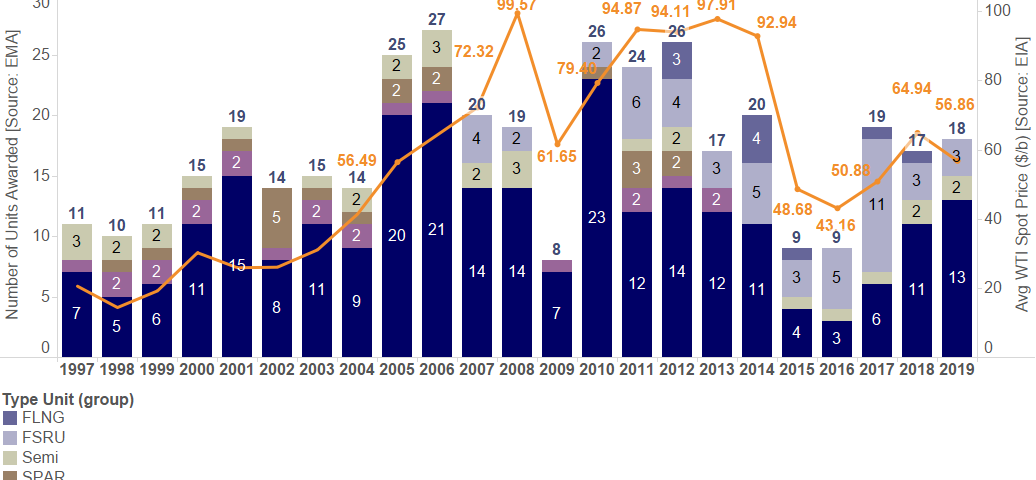
- Orders Continue. 19 contracts for Floating Production units were awarded in 2019, including 13 FPSOs, 3 FSRUs, 2 Production Semis, and 1 MOPU. By comparison, there were 11 FPSO orders last year and only 7 in 2017.
- Busy Times for Leading Contractors. There are 25 FPSOs currently on order. Two contractors are responsible for almost half of all the backlog: Modec is executing seven projects, while SBM has five units in progress, including two Fast4Ward hulls ordered on speculation.
- Let the Good Times Roll. In EMA’s seventh annual sentiment survey, 75% of respondents expected the Floating Production Sector upturn to last at least two more years, with 44% believing it was even more sustainable and could last three years or longer.
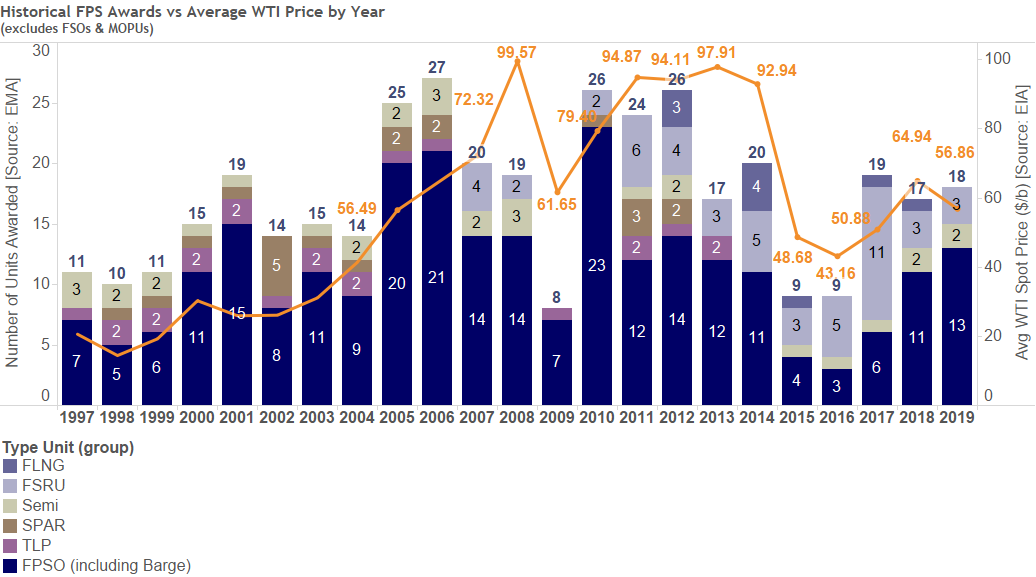
Figure 1. Chart of historical FPS awards vs. Average WTI Price, (c)EMA 2020
What does the future hold?
- Up to 175 Orders - Between 81-175 Floating Production Systems are expected over the next five years with a mid-case forecast of $99 billion to be spent on 125 units. The outlook has been adjusted slightly from last year, with a handful more FPSOs expected in the high-case scenarios. FPSOs remain the largest segment with over 40% of orders and 3/4th of capital expenditure. Close to $30 billion is expected to be spent on FPS projects in Brazil, driven by massive, deepwater FPSOs.
- Rise of the Redeployment – Four existing units were awarded new contracts this year (FPSOs Jotun A, Allan, MTC Ledang, as well as MOL FSRU Challenger). We expect this trend to continue, with redeployed units, particularly FPSOs, accounting for up to 25% of future awards.
- 45 Floating Production Systems are currently available – 25 FPSOs, 6 Production Semis, 6 FSOs, 5 MOPUs, 4 FSRUs, 2 FSOs, 1 Spars, 1 TLP, and 1 Production Barge. This is down five from the peak in 2017 due to redeployments and recycling of older FPSOs. The number of idle units is expected to remain high, with another 62 that could possibly come available within the next two years.
According to EMA’s Managing Director, David Boggs, “The floating production market experienced a strong 2019, with the highest level of FPSO awards in seven years. Brazil is firmly back, with five orders this year and is expected to account for 1/3rd of total spending over the next five years. Confidence has returned, particularly for the leading contractors, which are managing record orderbooks. SBM’s speculative Fast4Ward program has been a success with contracts secured for its first three FPSO hulls and orders placed for two more at the end of 2019. Oil companies now see attractive opportunities in offshore, particularly deepwater Brazil, Gulf of Mexico, and Australia. EMA has identified 30 projects that could be sanctioned within the next year and now the question is how will they be executed.”
About Energy Maritime Associates
Since 1996, EMA has been providing independent, expert analysis of the FPSO market with an unbiased view. We pride ourselves on the accuracy of information provided built through an extensive network of industry contacts, and our depth of knowledge in floating production. Trusted by more than 200 clients worldwide, EMA serves the entire FPSO market including E&P companies, service providers, capital investment firms, and asset and facility owners.
The Floating Production Systems Report is a must read for anyone requiring trustworthy analysis of the FPSO sector to effect better decision making, assess business risk, and provide insight into project alternatives.
2020 FPS Outlook Report: Table of Contents
A. Introduction to Floating Production Systems (FPS)
- Brief History of the Offshore Industry
- FPS Life Cycle
- FPS Unit Types
- Floating Production, Storage and Offloading Units (FPSOs)
- Production Semisubmersibles (Semis)
- Tension Leg Platforms (TLPs)
- Spar
- Floating Liquefied Natural Gas Units (FLNGs)
- Floating Storage and Regasification Units (FSRUs)
- Floating Storage and Offloading Vessels (FSOs)
- Mobile Offshore Production Units (MOPUs)
B. Current Market Status
- What Happened in 2019?
- Project Awards
- Project Deliveries
- Decommissioned Units
- What Does the Market Look Like as of Dec 2019?
- On Order
- Trend in Order Backlog
- Composition of Order Backlog
- Available Floating Production Systems
- FPS Units Likely to Cease Operations in 2020-2021
- Projects in the Planning Pipeline
- List of Leading FPS Operators and Owners
- Top FPS Operators (Planning Pipeline)
- Top FPS Owners
- Top FPS Operators (Installed Units)
- Top FPSO Owners
- Top FPSO Owners by Water Depth (Installed Units)
- Top FSO Owners
- Top SPAR Owners
- Top Production Semi Owners
- Top FLNG Owners
- Top FSRU Owners
- Top TLP Owners
C. Underlying Market Drivers
- Global Oil and Gas Demand Drivers
- Assessment of 2019 and Outlook for 2020
- Long Term Energy Demand
- Long Term Oil Demand
- Transportation and Petrochemical Growth Drives Oil Demand
- Long Term Gas Demand
- Renewables— Offshore Wind
- Global Oil and Gas Supplies
- Long Term Oil Production
- Outlook for Gas Production
- Global Oil Price
- Oil Futures
- Natural Gas Price
- U.S. Onshore Production and Investment
- Offshore Drilling
- E&P Development and Investment
D. Market Forecasts
- Summary of 2020-2024 Forecast
- Forecast Scenarios
- FPSO Forecast
- FLNG Forecast
- FSRU forecast
- FSO forecast
- Production SEMI forecast
- Production SPAR forecast
- TLP forecast
- Forecast Appendix
E. Floating Production Industry Survey
F. Contractor Focus
- Leasing Contractors
- Bluewater
- Bumi Armada
- BW Offshore (BWO)
- MISC
- MODEC
- SBM
- Teekay
- Yinson
- FSRU/FLNG Companies (Excelerate, Exmar, Golar, Hoegh)
- Excelerate
- Exmar
- Golar LNG
- Hoegh LNG
- EPC Contractors
- Chinese Yards
- Cosco Shipping Heavy Industry (CSHI)
- China Shipbuilding Industry Corporation (CSIC)
- China State Shipbuilding Corporation (CSSC)
- Wison Offshore & Marine
- Korean Yards
- Daewoo Shipbuilding & Marine Engineering (DSME)
- Hyundai Heavy Industries (HHI)
- Samsung Heavy Industries (SHI)
- Southeast Asian Yards
- Keppel
- Malaysia Marine and Heavy Engineering (MMHE)
- Sembcorp Marine (Jurong and Sembawang)
- Fig 1. FPS Units > 1,500m by Year Installed
- Fig 2. Installed FPS Units by Maximum Water Depth Over Time
- Fig 3. Regional Distribution of Installed Units 1991-2000
- Fig 4. Regional Distribution of Installed Units 2001-2010
- Fig 5. Regional Distribution of Installed Units 2011-2019
- Fig 6. FPS Awards in Relation to Oil Price
- Fig 7. FPS Life Cycle Schematic
- Fig 8. FPSO Schematic
- Fig 9. Mooring Systems Comparison
- Fig 10. Production Semi Schematic
- Fig 11. TLP Schematic
- Fig 12. SPAR Schematic
- Fig 13. FLNG Schematic
- Fig 14. FSRU Schematic
- Fig 15 FSO Schematic
- Fig 16. MOPU Schematic
- Fig 17. Awarded Units by Type
- Fig 18. Units Awarded in 2018 and 2019 by FPS Type
- Fig 19. Units Awarded in 2018 and 2019 by Capex
- Fig 20. Awarded Units 2016-2019 by Quarter
- Fig 21. Awarded Units 2016-2019 by Capex
- Fig 22. Distribution of Units Awarded in 2019 by Type
- Fig 23. Details for Units Awarded in 2019
- Fig 24. Units Awarded in 2019 by Capital Cost
- Fig 25. Units Awarded in 2019 by Yard
- Fig 26. Units Awarded in 2019 by Operator Category
- Fig 27. Units Awarded by Lease/Own
- Fig 28. FPSO Awards by Region
- Fig 29. FSRU Awards by Region
- Fig 30. FSO Awards by Region
- Fig 31. SEMI Awards by Region
- Fig 32. FPS Awards by Capex
- Fig 33. Units Delivered in 2019 by Region and Unit Type
- Fig 34. Details of Non-LNG Units Delivered in 2019
- Fig 35. Details of LNG Units Delivered in 2019
- Fig 36. Units Decommissioned in 2019
- Fig 37. Total Installed Units by Type
- Fig 38. Global Distribution of Installed Units by Type
- Fig 39. Installed Units by FPS Type and Region
- Fig 40. Table of Production and Storage Floaters by Type and Region
- Fig 41. FPS Units On Order by Type and Region
- Fig 42. FPS Units On Order/Under Repair by Name and Type
- Fig 43. Distribution of Units On Order by Destination
- Fig 44. Distribution of Units On Order by Yard
- Fig 45. FPS Order Book 1997-2019
- Fig 46. FPS Order Book by Unit Type
- Fig 47. Available FPS Units by Year of Lay-Up and Type
- Fig 48. Available FPS Units by Year of Lay-Up, Type and Status
- Fig 49. Possible Available FPSOs 2020-2021
- Fig 50. Possible Available Non-FPSO Units 2020-2021
- Fig 51. Projects in Planning Process
- Fig 52. Projects in Planning Process by Region
- Fig 53. Projects in Planning Process by Region and Water Depth
- Fig 54. Projects in Bidding/Final Design Stage by Region and Water Depth
- Fig 55. Projects in Planning Stage by Region and Water Depth
- Fig 56. Projects in Appraisal Stage by Region and Water Depth
- Fig 57. Top Operators by Projects in Planning Process
- Fig 58. Top FPS Unit Owners
- Fig 59. Top Operators by Units Leased or Owned
- Fig 60. Top FPSO Owners
- Fig 61. Top FPSO Owners by Water Depth
- Fig 62. Top FSO Owners
- Fig 63. Top Spar Owners
- Fig 64. Top Semi Owners
- Fig 65. Top FLNG Owners
- Fig 66. Top FSRU Owners
- Fig 67. Top TLP Owners
- Fig 68. Growth in Primary Energy Demand by Region
- Fig 69. Global Energy Demand Growth
- Fig 70. Global Energy Demand by Sector
- Fig 71. Average Annual Oil Demand Growth
- Fig 72. Global Oil Demand by Sector 2018-2040
- Fig 73. Liquids Demand
- Fig 74. Sectoral Oil Demand Growth
- Fig 75. LNG Imports by Region
- Fig 76. Shares in Long-Distance Gas Trade 2017 vs 2040
- Fig 77. Growth in Primary Energy Demand by Type
- Fig 78. Typologies Under Development
- Fig 79. Cost Breakdown for Fixed-Bottom & Floating Offshore Wind Projects
- Fig 80. Capex Estimates for Fixed-Bottom & Floating Wind
- Fig 81. EIA vs OPEC Oil Production Forecasts
- Fig 82. US Total Liquids Supply Outlook
- Fig 83. US Oil Production
- Fig 84. Natural Gas Supply by Region
- Fig 85. 2017 Major LNG Flows
- Fig 86. WTI and Brent Spot Price by Month
- Fig 87. World Liquid Fuels Production and Consumption Balance
- Fig 88. Brent Futures Trading Rates Q-o-Q
- Fig 89. Brent Futures Trading Rates Y-o-Y
- Fig 90. Henry Hub Spot Gas Prices
- Fig 91. Henry Hub Natural Gas Price and NYMEX Confidence Intervals
- Fig 92. North American Rotary Count vs Oil Price
- Fig 93. North American Rotary Count vs Oil Price
- Fig 94. Jackups Fleet Supply and Utilization
- Fig 95. Drillships Fleet Supply and Utilization
- Fig 96. Semisubmersibles Fleet Supply and Utilization
- Fig 97. Offshore Upstream Investment by Water Depth and Scenario
- Fig 98. Offshore Upstream Investment by Region and Scenario
- Fig 99. Offshore Production Facilities in Selected Years by Scenario
- Fig 100. Upstream Investment by Type
- Fig 101. FPS Forecast by Unit Type
- Fig 102. Capex Forecast by Region and FPS Type
- Fig 103. Growth of FPS Inventory
- Fig 104. Forecast by FPS Type and Capex
- Fig 105. Historical Growth of FPSO Inventory
- Fig 106. FPSO Awards 2003-2024
- Fig 107. Forecast of FPSO Awards per Year (2020-2024)
- Fig 108. FPSO Awards 2020-2024 with Petrobras’ Proportion
- Fig 109. FPSO Forecast by Hull Type
- Fig 110. FPSO Processing by Lease Own
- Fig 111. FPSO Awards by Lease Own
- Fig 112. FPSO Forecast by Production Capacity
- Fig 113. Leased FPSO Forecast by Production Capacity
- Fig 114. FPSO Capex by Hull Type
- Fig 115. FPSO Awards by Region
- Fig 116. FPSO Capex by Production Ranges and Hull Type
- Fig 117. FPSO Orders by Production Ranges and Hull Type
- Fig 118. FLNG Orders and Deliveries
- Fig 119. FLNG Orders by Unit Size
- Fig 120. FLNG Forecast and Capex by Unit Size
- Fig 121. Historical Growth of FSRU Inventory
- Fig 122. Historical FSRU Orders
- Fig 123. FSRU Awards by Lease/Own
- Fig 124. FSRU Forecast by Unit Size
- Fig 125. FSRU Forecast and Total Capex by Unit Size
- Fig 126. Historical FSO Inventory
- Fig 127. Historical FSO Orders
- Fig 128. FSO Forecast by Unit Size
- Fig 129. FSO Forecast and Capex by Unit Size
- Fig 130. Historical Inventory of Semis
- Fig 131. Historical Semi Orders
- Fig 132. Semi Forecast by Unit Size
- Fig 133. Semi Forecast and Capex by Unit Size
- Fig 134. Historical Inventory of Spars
- Fig 135. Historical Spar Orders
- Fig 136. Spar Forecast by Unit Size
- Fig 137. Spar Forecast and Capex by Unit Size
- Fig 138. Historical TLP Inventory
- Fig 139. Historical TLP Orders
- Fig 140. TLP Forecast by Unit Size
- Fig 141. TLP Forecast and Capex by Unit Size
- Fig 142. Likely Awards in 2020
- Fig 143. Confidence in Business Outlook
- Fig 144. Expected Length of Upturn
- Fig 145. Impact of Upturn
- Fig 146. Cost Inflation Expected in next 12 Months
- Fig 147. Activity Levels
- Fig 148. Largest Obstacle for Awards
- Fig 149. Capacity Constraints
- Fig 150. Most Attractive Regions
- Fig 151. FPS Type with the Highest Growth Opportunities
- Fig 152. Technologies with the Largest Impact
- Fig 153. Outlook for Leased, Newbuilt, and Redeployed Units
- Fig 154. Expectations on Projects to be Completed
- Fig 155. Survey Profile -Business
- Fig 156. Survey Profile - Position
- Fig 157. Top Leasing Contractors and Their Fleets
- Fig 158. Top Leasing Contractors and Their Fleets by Region
- Fig 159. Bluewater- Contracts by Field Operator
- Fig 160. Bluewater- Asset Distribution by Region
- Fig 161. Bluewater- Fleet Status
- Fig 162. Bumi Armada- Contracts by Field Operator
- Fig 163. Bumi Armada- Asset Distribution by Region
- Fig 164. Bumi Armada- Fleet Status
- Fig 165. BWO- Contracts by Field Operator
- Fig 166. BWO- Asset Distribution by Region
- Fig 167. BWO- Fleet Status
- Fig 168. MISC- Contracts by Field Operator
- Fig 169. MISC- Asset Distribution by Region
- Fig 170. MISC- Fleet Status
- Fig 171. Modec- Contracts by Operator
- Fig 172. Modec- Asset Distribution by Region
- Fig 173. Modec- Fleet Status
- Fig 174. SBM- Contracts by Field Operator
- Fig 175. SBM- Asset Distribution by Region
- Fig 176. SBM- Fleet Status
- Fig 177. Teekay- Contracts by Field Operator
- Fig 178. Teekay- Asset Distribution by Region
- Fig 179. Teekay- Fleet Status
- Fig 180. Yinson- Contracts by Field Operator
- Fig 181. Yinson- Asset Distribution by Region
- Fig 182. Yinson- Fleet Status
- Fig 183. Excelerate- Contracts by Field Operator
- Fig 184. Excelerate- Asset Distribution by Region
- Fig 185. Excelerate- Fleet Status
- Fig 186. Exmar- Contracts by Field Operator
- Fig 187. Exmar- Asset Distribution by Region
- Fig 188. Exmar- Fleet Status
- Fig 189. Golar- Contracts by Operator
- Fig 190. Golar- Asset Distribution by Region
- Fig 191. Golar- Fleet Status
- Fig 192. Hoegh- Contracts by Operator
- Fig 193. Hoegh- Asset Distribution by Region
- Fig 194. Hoegh- Fleet Status
- Fig 195. EPC Contractor Orderbook by Type
- Fig 196. SEA Yards - Client Distribution
- Fig 197. Korean Yards - Client Distribution
- Fig 198. Chinese Yards - Client Distribution
- Fig 199. SEA Yards - Order Destination
- Fig 200. Korean Yards - Order Destination
- Fig 201. Chinese Yards - Order Destination
- Fig 202. COSCO - Orders by Client
- Fig 203. COSCO - Order Destination
- Fig 204. COSCO - Order Backlog
- Fig 205. CSIC - Orders by Client
- Fig 206. CSIC- Order Destination
- Fig 207. CSIC - Order Backlog
- Fig 208. CSSC - Orders by Client
- Fig 209. CSSC - Order Destination
- Fig 210. CSSC - Order Backlog
- Fig 211. Wison - Orders by Client
- Fig 212. Wison - Order Destination
- Fig 213. Wison - Order Backlog
- Fig 214. Daewoo - Orders by Client
- Fig 215. Daewoo - Order Destination
- Fig 216. Daewoo - Order Backlog
- Fig 217. Hyundai - Orders by Client
- Fig 218. Hyundai - Order Destination
- Fig 219. Hyundai - Order Backlog
- Fig 220. Samsung - Orders by Client
- Fig 221. Samsung - Order Destination
- Fig 222. Samsung - Order Backlog
- Fig 223. Keppel - Orders by Client
- Fig 224. Keppel - Order Destination
- Fig 225. Keppel - Order Backlog
- Fig 226. MMHE - Orders by Client
- Fig 227. MMHE - Order Destination
- Fig 228. MMHE - Order Backlog
- Fig 229. Sembcorp - Orders by Client
- Fig 230. Sembcorp - Order Destination
- Fig 231. Sembcorp - Order Backlog
2020 FPS Outlook Report: List of Illustrations
A. Introduction to Floating Production Systems (FPS)
B. Current Market Status
C. Underlying Market Drivers
D. Market Forecasts
E. Floating Production Industry Survey
F. Contractor Focus
In its 2020-2024 Floating Production Systems Outlook Report, Energy Maritime Associates (EMA), analyzed the activity in 2019, recent industry trends and conducted a sentiment survey to develop a forecast for all types of Floating Production Systems including FPSO, FLNG, FSRU, TLP, Spar, Semi, and FSO.
